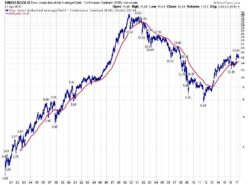
Divide the value of the Dow Jones 30 Industrials by the current price of gold and you get the Dow Gold Ratio. Plot the ratio every day on a chart and you can watch how the ratio changes over time. The chart  is too small to see but it starts in 1980 with a Dow Gold Ratio (DGR) of about 1. The DGR went up to about 42 in 2001 and then fell to less than 6 in 2008. As I write this the DGR has climbed back to about 17.
